10 Best CMMS Reports to Optimize Maintenance Processes

Discover 10 types of CMMS reporting that can help you optimize your maintenance processes. Learn what these top CMMS reports entail and why they matter.

ServiceChannel
Reporting and analytics are essential features of a computerized maintenance management system (CMMS). A modern CMMS can generate dozens of reports, giving maintenance managers access to a wealth of data.
But all that information can lead to choice paralysis. With seemingly endless options available to them, many managers are unsure which reports will provide the data to support actionable insights into maintenance operations.
If you’re one of them, this guide is for you. In it, you’ll find 10 key performance indicators and dashboards that can help you optimize your maintenance processes. Read on to discover the best CMMS reporting functions to help you accomplish your operational goals.
Key Takeaways:
- Computerized maintenance management system (CMMS) reporting provides actionable insights into asset performance and the efficiency of maintenance tasks.
- Facilities maintenance analytics supports increased asset longevity and streamlined work order management.
- Essential maintenance KPIs for maintenance managers and financial officers include preventive vs. reactive work order ratios, mean time between failures (MTBF), mean time to repair (MTTR), and more.
- CMMS software offers custom reporting capabilities, giving you the freedom to track the information you need to make informed decisions.
- Automated CMMS reporting and analytics simplify KPI tracking, producing reports according to preset schedules and in response to predetermined events.
- ServiceChannel CMMS solutions have the robust reporting capabilities required to help optimize your maintenance procedures.
1. Work Orders by Type (Preventive vs. Reactive)
Your CMMS can categorize work orders by the type of maintenance activities performed. As a result, you can use its reporting functions to compare the number of preventive maintenance tasks to reactive tasks.
How to Calculate Preventive vs. Reactive Work Order Ratio
To calculate the ratio of reactive vs. preventive maintenance work orders, first determine the reporting timeframe, such as one quarter or a full year. Then, your maintenance software can total the number of preventive maintenance requests versus reactive work orders. You can then observe how this ratio changes over time.
Why Tracking Preventive vs. Reactive Work Orders Matters
Monitoring the ratio of reactive vs. preventive maintenance work orders helps you see where most resources and time are spent. Preventive maintenance work tends to cost less over time. It also increases reliability and reduces stress for your team. When you see preventive maintenance tasks far exceeding reactive work orders, you’ll know that your strategies to minimize emergency repairs are effective.
2. Mean Time Between Failures (MTBF)
In CMMS reporting, Mean Time Between Failures (MTBF) tells you how much time passes between equipment breakdowns. It’s a critical measure of asset reliability that your maintenance management software can provide.
How to Calculate MTBF
To calculate the MTBF for a piece of equipment, first calculate its total operating time. Then, divide that number by the total number of failures.
Why Tracking MTBF Matters
Gathering consistent MTBF data based on maintenance history helps you develop predictive maintenance strategies. For example, say a piece of equipment has an MTBF of 2,000 errors. After 1,800 operating hours, you can schedule preventive maintenance to decrease the risk of failures. Decreasing MTBF over time can also be a sign of effective maintenance scheduling.
3. Mean Time to Repair (MTTR) and Downtime Analysis
Mean Time to Repair (MTTR) is another key data point your CMMS software can provide. It tells you how long it takes you to repair specific equipment or systems. It, along with other metrics, is useful for analyzing downtime.
How to Calculate MTTR and Interpret Downtime Data
To calculate MTTR, record all downtime in the asset information retained by your maintenance management software. Total the time and count the number of repair incidents during that timeframe. Then, divide the time by the number of repairs.
Other maintenance data that can help you analyze downtime include:
- Total Downtime: The sum of all downtime
- Downtime Percentage: Total downtime divided by total available hours
- Asset Availability Score: MTBF divided by the sum of MTBF and MTTR
Why Tracking MTTR and Equipment Downtime Matters
You can use downtime metrics to identify issues in workflows for maintenance activities. For example, you may observe that a certain type of critical equipment has a longer MTTR. Then, you can examine and refine processes to improve asset availability.
4. Asset Health Dashboard
In maintenance management software, an asset health dashboard is a visual data analytics tool. It allows you to view key asset health and performance data in real time in one convenient location.
Key Performance Indicators for Asset Health
Most maintenance software asset health dashboards provide the following useful metrics:
- Asset Performance and Condition Data: Varies by equipment and may include temperature, vibration, pressure, noise, etc.
- Usage Frequency: How often you utilize assets.
- MTBF and MTTR: Calculated using historical data for each asset.
- Total Work Orders and Completion Rate: Number of scheduled and unscheduled work orders for each asset, and what percentage your team completed.
- Overall Asset Health Score: Often color-coded green, yellow, or red.
Why Asset Health Dashboards Matter
An asset health dashboard simplifies CMMS reporting by gathering all the information you need to monitor assets in one place. Index scores let you spot signs of trouble early, strengthening predictive maintenance initiatives. In addition, dashboards support data-driven capital planning decision-making by signaling when assets are near the end of the lifecycle.
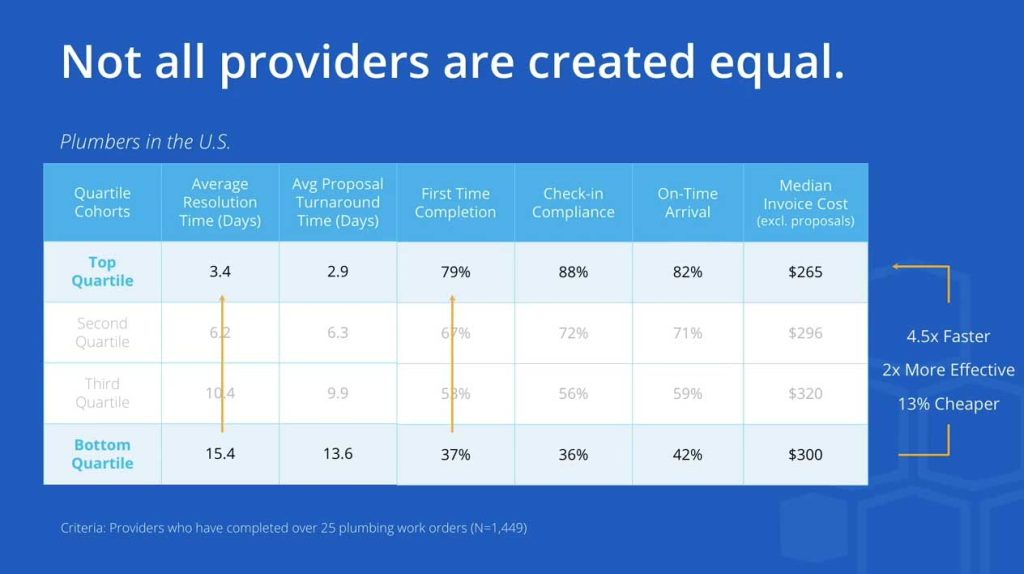
5. Contractor Performance Scorecards
Not all actionable facilities management reports relate to your equipment. You can also use your maintenance management system to evaluate vendors and contractors. This tool combines various types of data into one report for your review. Contractor scorecards can also be useful for contracting businesses to monitor client satisfaction over time.
Key Contractor Performance Metrics
Some key metrics CMMS reporting tools can track and use in contractor scorecards include:
- Average Response Time: How long it takes for a contractor to begin maintenance
- First-Time Fix Rate (FTFR): How many issues get resolved on the first attempt
- Cost Per Work Order: Average amount paid for each service request the contractor completes
- Cost Variance: Difference between stated and actual maintenance costs
Why Track Contractor Performance With CMMS
Conducting effective contractor performance evaluations leads to more informed decision-making about contract renewals. CMMS reporting can remove the subjectivity from the review process by supplying you with data at a glance.
For contractors, the scorecard feature of CMMS reporting is a simple yet powerful way to assess provider performance. It helps quickly identify downward trends so that contractors can address them. Consequently, the maintenance reporting can help improve customer retention rates over time.
6. Maintenance Cost Analysis
Cost analysis is another key component of CMMS reporting. It is the process of studying the total costs of all maintenance tasks for your equipment.
Key Maintenance Cost Metrics
Some information that maintenance software will typically use for a cost analysis include:
- Overall Total Maintenance Cost: Sum of all costs of labor, parts, tools, downtime costs, and contracts
- Total Cost Per Asset: How much you spend to maintain each asset
- Overtime Cost: Amount spent to pay extra hours to maintenance teams
- Emergency Parts Order Cost: How much you spend to rush orders for emergency repair
Why Tracking Maintenance Costs Matters
Cost analytics enables maintenance managers to identify areas of maintenance operations that cost organizations the most money. Data provided by CMMS reporting can provide insights into savings opportunities. It also promotes more confident financial decision-making and accurate budget forecasting.
Maintenance managers can also use data derived from CMMS cost analysis to justify maintenance operations expenses to higher-ups. In this way, CMMS analytics supports better communications between upper and middle management.
7. Parts Inventory Utilization Report
A parts inventory utilization report provides an overview of how you use the spare parts and materials in your inventory during a specific timeframe. It’s a vital CMMS report for inventory management.
Key Inventory Management Metrics
Some key metrics typically included in inventory management CMMs reporting are:
- Grand Totals: Number of each part used during maintenance activities
- Usage Frequency: How often you use each part
- Inventory Turnover Ratio: How many times you use and replenish parts
- Stockout Occurrences: How many times you run out of a specific part
- Days on Hand: Mean number of days you store a part before you use it
Why Tracking Parts Inventory Utilization Matters
CMMS reporting can strengthen inventory management by helping you identify issues. With the data it provides, you can improve parts order decision-making. For example, you can order fewer slow-moving parts to reduce costs.
Tracking inventory utilization also reduces downtime from spare part shortages and waste associated with costly emergency parts orders. All in all, better inventory transparency leads to greater operational efficiency.
8. Safety and Compliance Reports
Safety and compliance CMMS reporting provides vital data. It tells you how well your team and overall organization adhere to industry regulations regarding occupational safety, environmental protection, and more.
Components of Safety and Compliance Reports
Some data points your CMMS software can place in compliance reports include:
- Incident Counts: Number of workplace accidents and illnesses
- Root Cause Analysis Results: Summarizes the cause of safety incidents
- Lost Time Injury Frequency Rate (LTIFR): How many injury-causing incidents occur per million hours worked.
- Mean Time to Correct Safety Issues (MTTC): Average time it takes for maintenance teams to correct safety issues
How Maintenance Reporting Supports Risk Management
Ensuring maintenance activities comply with all regulations is crucial for risk management. Maintenance reporting can alert you to safety issues. By then remedying them, you can promote operational safety and help reduce incident rates.
In addition, your CMMS can deliver transparent compliance data that reassures teams and stakeholders. Monitoring this data can also minimize the risk of the financial and reputational costs of noncompliance.
9. Energy Consumption Reports
Energy consumption reports detail how much energy your equipment uses. While highly useful, they are one type of CMMS reporting that many organizations neglect.
Key Performance Indicators from Energy Consumption Reports
Some maintenance data KPIs related to energy consumption include:
- Total Consumption: Measures how much electricity, thermal energy, or fuel used
- Energy Consumption per Unit of Output: Energy consumed per product, service, batch, etc.
- Energy Efficiency Ratio (EER): Obtained by dividing output by total energy consumption
- High-Energy Asset List: Ranking of the equipment utilizing the most energy
Why Energy Consumption Maintenance Reporting Matters
Regular energy use maintenance reporting can drive progress toward sustainability goals. Based on results, you can make data-driven decisions to conserve energy. For example, you may choose to replace equipment that is no longer efficient to cut energy usage. Even small energy optimizations can significantly reduce operational costs over time.
10. Custom and Scheduled Reports
In addition to preset reporting capabilities, CMMS software gives you the ability to customize reporting and analytics. Whether you want to monitor preventive maintenance more closely or rein in costs, you can create custom reports to measure your progress.
CMMS software also enables you to automatically schedule reporting. Once set up, the CMMS can generate and distribute reports according to a set schedule or in response to key events. With automated reporting, you can send regular summaries to foster trust and accountability with leadership. You can also share performance-related reports with maintenance teams. For example, you might automatically send work order completion data to your team each month.
Optimize Your CMMS Reporting Practices with ServiceChannel
Running and analyzing the above CMMS report can help you refine your maintenance operations. Insights gained through robust reporting can help you move from reactive to predictive maintenance strategies. They can help you make informed decisions about asset management and capital planning, and they can support continuous improvements in team performance.To make the most of CMMS reporting potential, you need the right system in place. ServiceChannel has the CMMS solutions you need to boost operational efficiency and inform your decision-making. We can help you build and implement a CMMS system that aligns fully with your needs.
Get in touch with us today to get started.