How to Use a Fishbone Diagram for Healthcare Productivity
Enhance healthcare efficiency with a fishbone diagram. Identify root causes for improved patient outcomes and operational success.

ServiceChannel
Healthcare professionals must find creative ways to improve healthcare operations while controlling costs. Equipment failures, staffing shortages, and long patient wait times are just a few of the challenges impacting care quality and operational efficiency.
Many facilities find themselves in a break-fix cycle when it comes to resolving these issues. Far too often, they only address the symptoms of the problem without addressing the underlying causes.
A fishbone diagram, called an Ishikawa diagram, gives your team a clear visualization for root-cause analysis. This tool helps break down complex problems by categorizing potential causes. As a result, it’s much easier to find effective methods to solve the issue based on data.
Here is how it works and how you can use it.
What Is a Fishbone Diagram?
The fishbone diagram, named for its fish-like shape, provides a visual framework for identifying, exploring, and displaying the possible causes of a specific problem. For example, a hospital experiencing increased wait times in the emergency room can use a fishbone diagram to assess different factors causing the long line.
Each line or “bone” of the fishbone diagram represents a category. Each category represents a potential root cause of the issue. Returning to our wait times example, potential categories may include inefficient scheduling or limited bed space.
From there, your team members can gradually narrow down the specific cause of your healthcare operational challenges through group discussion and analysis. This pictorial display of possible causes makes it easier to pinpoint the issue so you can implement targeted solutions for quality improvement.
How To Construct a Healthcare Fishbone Diagram
Now that you know what a fishbone diagram is and how creating it can help you zero in on potential issues, here is an overview of how to construct one to help your team determine what factors may contribute to creating your greatest challenges.
1. Define the Problem Statement
The “head of the fish” represents the specific problem you want to resolve. Clearly define what the issue is, who it affects, and the impact it has. The problem statement should also describe what needs to be solved, not how to solve it. You want to be as objective as possible in your root-cause analysis; there is always a chance that the root causes of the problem are something entirely unexpected.
2. Identify Major Cause Categories
Brainstorm broad categories that could be contributing factors. Take a collaborative approach by asking various healthcare team members to get a list that is as unbiased as possible. You will almost always have multiple categories, even if the cause and effect seem obvious at first glance.
The “bones of the fish” tend to be categorized into 7 major categories, also known as the 7 Ms. Those major categories include the following factors:
- Manpower: The people involved in your processes. Challenges may include understaffing, insufficient training, or overworked staff.
- Machines: The equipment or technology used in your process. Challenges may include outdated technology, frequent equipment failures, or a lack of integration between systems.
- Materials: The supplies you need to complete your process. Challenges may include supply chain disruptions, device shortages, or over-reliance on back-ordered items.
- Methods: How you conduct the process itself. Challenges may include inefficient workflows, a lack of standardized protocols, or outdated procedures.
- Measurement: The quality control standards you use to evaluate outcomes. Challenges may include inconsistent data tracking, inaccurate reports, or unreliable feedback.
- Mother Nature: External environmental contributing factors, such as floods or recent storms. In the case of healthcare, this may also include public health crises or recent outbreaks. You may also use this category to assess human-caused external factors like political or regulatory changes.
- Management: Healthcare facility management’s organizational policies and how they are enforced. Challenges may include ineffective communication, misalignment between leadership and frontline staff, or lack of accountability.
Let’s Get Started
Get started with ServiceChannel today and transform your healthcare facility management.
3. Brainstorm Potential Causes
Each main category, as listed above, will have sub-categories. For each bone, simply list one of the 7 Ms. Then, the potential causes, or “ribs” of the fish, would represent how these categories may be causing the issue.
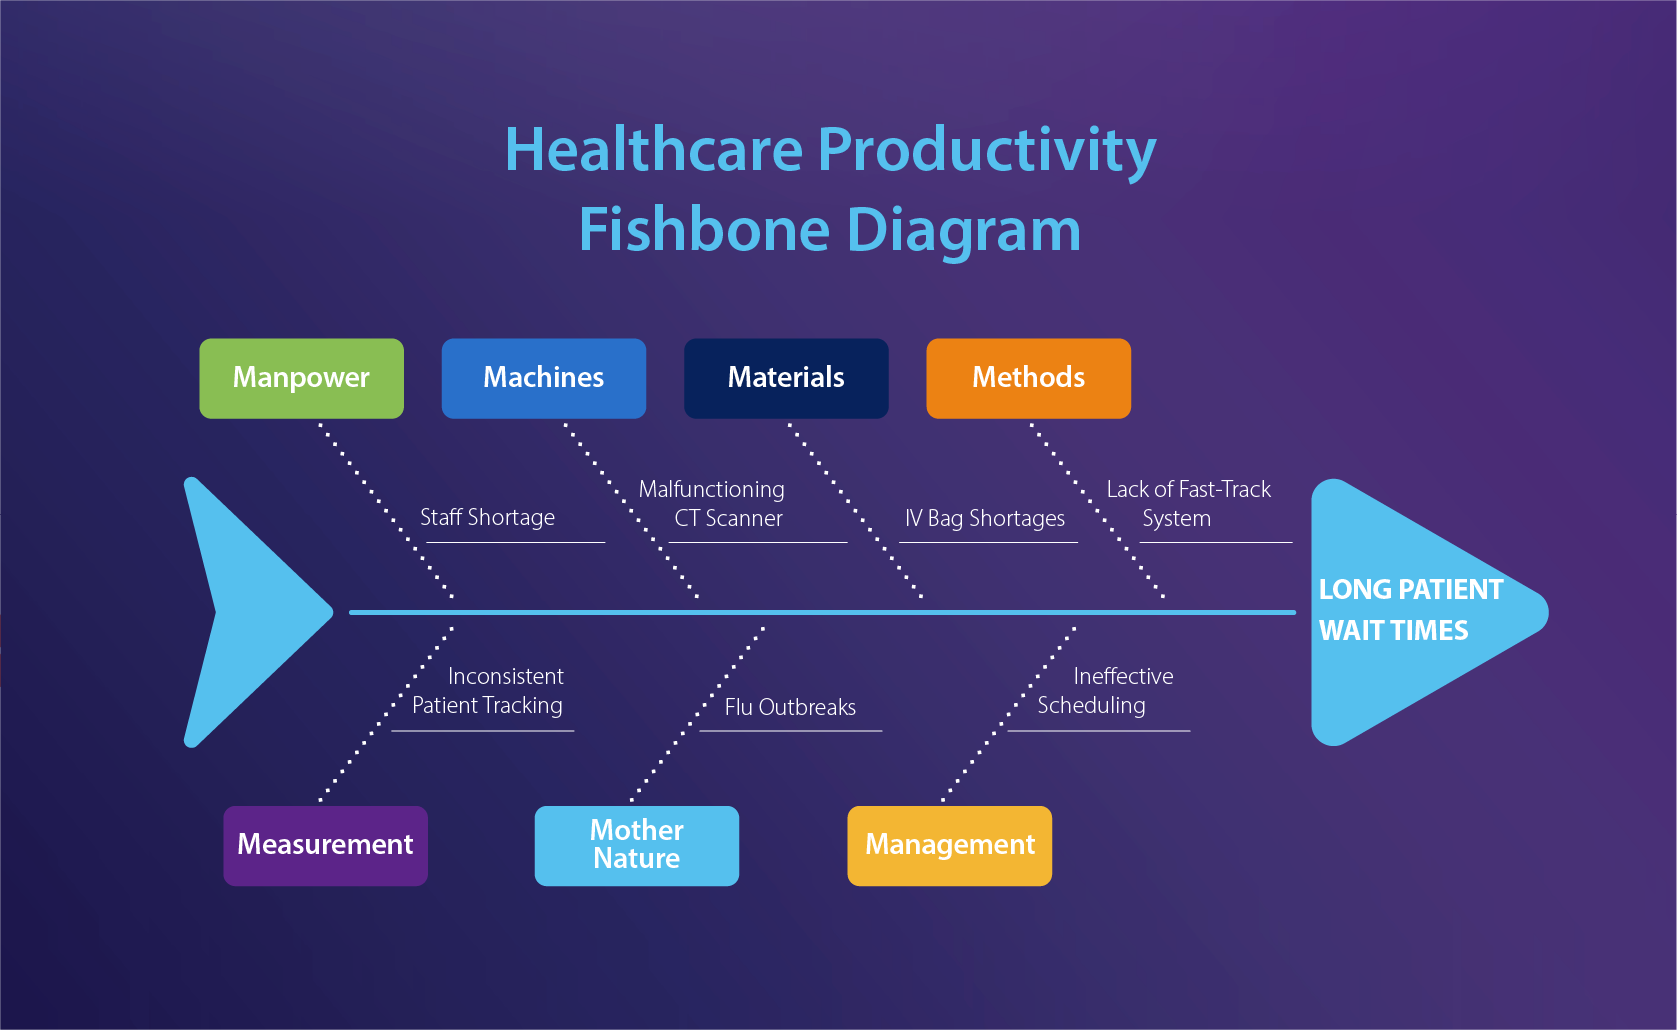
Let’s return to our example of long ER wait times again. If long wait times are the head of the fish, these may be your subcategories for each of the 7 bones (matching the list in step 2):
- A shortage of nurses leads to slower patient intake
- A malfunctioning CT scanner means that patients who need a CT scan must wait longer
- A shortage of IV bags forces staff to find alternatives
- A lack of a fast-track system for minor cases results in all patients waiting the same amount of time
- Inconsistent tracking of patient flow
- A severe flu outbreak increases patient volume beyond normal capacity
- Ineffective shift scheduling that leads to staffing gaps
4. Add Sub-Causes
Adding “smaller bones” onto your “ribs” can help your team members identify cause and effect. You would demonstrate sub-causes to brainstorm the “why” behind the identified issues. People often refer to this process as the “5 Whys” because it involves asking “why” five times before reaching a conclusion.
So, if we were to look at the “manpower” category with the related sub-category “shortage of nurses,” here are 5 example whys you might ask:
- Why is there a shortage of nurses?
High turnover rates among nursing staff. - Why is turnover so high?
Many nurses leave due to burnout and job dissatisfaction. - Why are nurses experiencing burnout?
High patient loads and frequent overtime contribute to fatigue. - Why do nurses have such high patient loads?
Our facility has not hired enough staff to meet demand. - Why has our facility not hired enough nurses?
Budget constraints and difficulty in recruiting qualified candidates.
Once you have your conclusion, you can start to brainstorm targeted solutions. For instance, if you found an issue in your “Machines” category, you could leverage the benefits of preventive maintenance to prevent the tool from breaking down.
Explore ServiceChannel’s resources on preventive maintenance to minimize equipment-related causes.
How to Analyze and Act Upon Your Fishbone Diagram
Your analysis will likely determine that multiple contributing factors are causing the issue. Therefore, implementing a targeted solution isn’t as simple as addressing one root cause.
1. Prioritize Causes
Some of the issues you reveal in your analysis may impact operations more than others. For the sake of time, assess how to resolve those issues first. IV bags, for instance, are crucial to patient safety. A shortage would affect patient care and patient outcomes, not just ER wait times. So, that issue should be addressed quickly.
2. Investigate Root Causes
Gather data to validate the most likely root causes. This process might involve reviewing incident reports, interviewing staff, observing processes, or analyzing maintenance logs.
3. Develop and Implement Solutions
Use the data you collected during your investigation to develop and implement a highly targeted solution. A thorough understanding of what is happening will help you develop solutions that assess the issue with precision.
4. Monitor and Evaluate
Track key metrics to assess the effectiveness of your solutions. Having this data will allow you to demonstrate the effectiveness of your solutions and help you recognize areas of improvement when needed.
For example, a manager may identify a recurring issue with your HVAC systems. In that case, you can use the fishbone diagram to trace it back to outdated maintenance protocols. Knowing that’s the root cause, your team can implement a new schedule and monitor temperature fluctuations to measure quality improvement and optimize HVAC efficiency.
Contact us to learn how ServiceChannel can streamline your work order management and improve response times to critical issues.
Work with ServiceChannel to Optimize Your Healthcare Operations
ServiceChannel’s platform offers collaborative tools to share insights from your fishbone diagram and coordinate solutions for healthcare improvement. Our tool offers a single source of truth, making it much easier for your healthcare teams to identify the root cause and effect behind each challenge or outcome you face in any process.
Some of the key benefits of using ServiceChannel’s tool include the following:
- Collaborative problem-solving
- Data-driven insights
- Automated work order tracking to help resolve backlog issues
- Real-time insights into the relationship between your solutions and process improvements
- Streamlined communication to prevent misunderstanding while you deliver high-quality patient care
When you use ServiceChannel, you may eliminate the need to create a fishbone diagram. Our tool includes all the insights you need in a user-friendly layout.
So, it’s easy to see the cause and effect of each issue without going through the process of creating a fishbone diagram.
Contact us today to learn how we can play a crucial role in your healthcare operations.