ServiceChannel
Modified on
December 19, 2022
Table of Contents
See how your repair and maintenance spend and service costs compare to industry trends with our Facilities Spend Index.
See how your repair and maintenance spend and service costs compare to industry trends with our Facilities Spend Index.
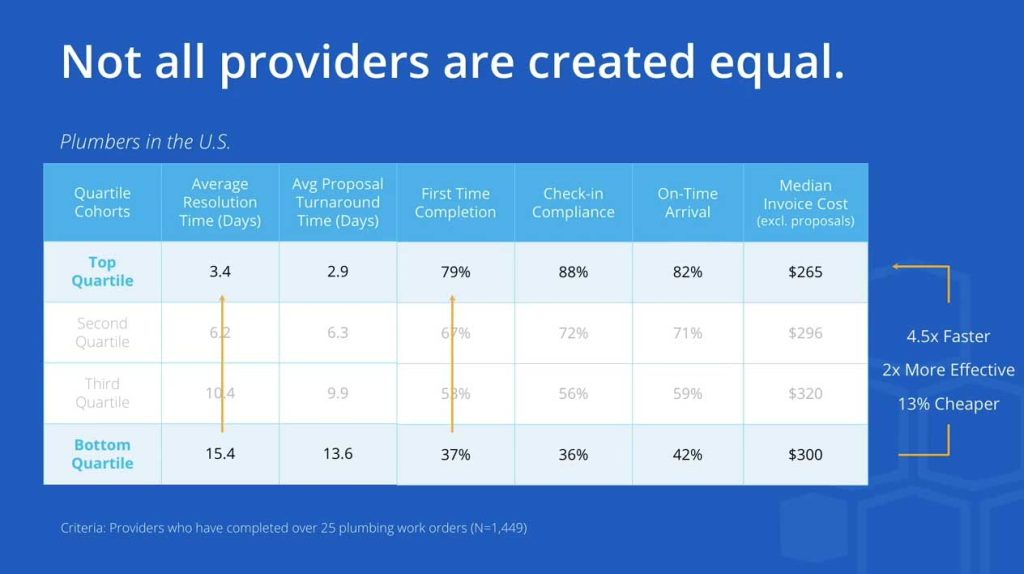
The Facilities Spend Index is the Source of Truth for Facilities Management Data
We are proud to announce the launch of a new economic indicator for tracking the spend levels and costs of service across the U.S. at commercial locations. The Facilities Spend Index™ analyzes quarterly trends for overall spend at the national level, along with a focus on key commercial trades in large metro regions. The tool offers an unprecedented look into how brands are investing in their locations and how costs have been changing the last several years.
The Facilities Spend Index™ measures spend on facility operations across maintenance, repairs, and capital investments, based on $22 billion dollars in services delivered to 391,000 locations on the ServiceChannel platform since 2018. Now, you have access to actionable insights from this unique treasure trove of data.
Use the Facilities Spend Index to:
- See where your budgets are growing faster than industry spend overall.
- Compare your invoice cost trends to the Service Cost Index.
- Choose between trades and regions to explore different markets.
How to use the Facilities Spend Index
This interactive tool helps you see the data that will help you while turning down the noise that doesn’t. You can explore broad trends or drill down into specifics. If you’re interested in a particular trade, you can zoom in on that. Or if you only want to see data from a particular region, you can do that too. You can zero in on janitorial data for Dallas, or HVAC data for Los Angeles. Hover over a particular date for specific data points.
To keep things simple for readers, we’ve included a handful of common trades and regions. If you’re interested in data for another trade or region, please contact us.

How we gathered all this facilities management insight
We’ve been in this industry for over 20 years, working with hundreds of customers, spanning dozens of industries. That’s given us unmatched, granular data showing how leading brands and your industry peers are running their facilities programs and delivering great customer experiences. We’ve helped them manage 391,000 locations since 2018 alone, while tracking millions of work orders and optimizing their spend. Now we’re bringing these insights together and making them useful and actionable for you.
The Facilities Spend Index shows you the big picture, with trends for how other brands are reallocating their budgets, as well as for how service costs are changing. When you’re ready to dive deeper into the data, we provide industry benchmark reports that help to compare your spend, providers, and assets against your peers. Check out the recent Facilities Benchmark Reports for the quick-serve restaurant industry and the grocery industry. We’re making it easy for you to benchmark your operations so you can take your budget further and raise your performance level.
“Data is the foundation for peak facilities performance. We use hundreds of metrics to optimize our clients’ locations and assets in real-time. Being data-driven also accelerates progress. By benchmarking every brand and provider on our platform, we are driving continuous improvement and innovation across the industry.”
– Alicia Barco, Chief Data Officer, ServiceChannel
Major trends you should know about
1. Spend is growing after recovery from pandemic lows.
Nationwide facilities spend across all trades climbed 33% in the year since the wide scale shutdowns in Q2 2020. Halfway through 2021, the overall spend level is outpacing 2019 by 5%, which shows that brands are investing more in their locations to win back in-person shoppers and build trust through the store experience.
As essential businesses with locations that stayed open, the Grocery, Convenience, and Big Box Retail sectors maintained higher spend throughout the pandemic. Their budgets are now about 10% higher than 2019. Meanwhile, the Restaurant sector cut back more during shutdowns, and its spend has rebounded to be level with 2019.
2. Costs have been rising, with recent relief
Overall service costs nationwide were 9% higher in Q2 2021 than a year earlier, driven by an 11% increase in material cost. Invoice costs peaked in Q4 2020, and have since fallen by 8% as labor time decreased. Since 2018, rising invoice costs were caused by increasing labor rates, up over 7% annually, along with growing material costs, up over 12% annually.
3. Cleaning spend remains elevated, but is on the decline
Spend on the janitorial trade peaked up 24% year-over-year (YOY) in Q4 2020, when locations had reopened and cases were spiking. The expanded scope of cleanings led to a 29% increase in labor spend. Since the peak, nationwide spend has dropped 17%, but it remains 15% higher in Q2 2021 than Q2 2019.
There’s more where all this came from
Many facilities operations teams are currently operating in a black box. They’re making decisions based on instinct, not data. They’re not measuring how they’re performing, and they have no idea how the competition is performing. The Facilities Spend Index will help you get a better view of what’s going on in the industry. But to get the best outcomes at the lowest costs, you need to take the next step.
Leading brands rely on the ServiceChannel platform to obtain unprecedented visibility into their facilities and assets. The benchmarking results show how they deliver value to their organizations through data-driven management of critical assets, work orders, and service provider performance. With every new customer that joins our platform, we collect more data on facilities performance, and every existing customer benefits from it.
Want to know how your spend measures up?
Go explore the Facilities Spend Index and find out how your spend compares to your peers’. ServiceChannel’s platform is your source of truth for facilities operations data. If you want to know whether you’re putting the right amount of money in the right places for peak performance, reach out to request a demo. See how your facilities performance compares to your industry peers with a custom assessment.