ServiceChannel explained in 100 seconds
Let your Operations team focus on customer service and sales, so you can grow your business without limits.

The ServiceChannel Facilities Spend Index™ monitors commercial trade service costs and spending patterns based on $74 billion dollars in services delivered to 630,000 locations on the ServiceChannel platform.
1. Spend Is Hitting New Highs
Nationwide facilities spend across all trades in Q1 2025 increased 7% year-over-year (YOY) from Q4 2024, down eight points from the previous quarter’s growth. Total spend climbed by 7% annually since 2019.
2. Inflation Is Still a Problem
Service costs nationwide grew by 4% YOY in Q1 2025 down from 6% growth a year earlier. Material costs rose by 9.7%, and labor costs increased by 10.7%, driven by an 8.6% rise in labor rates, while labor hours remained unchanged year over year.
3. HVAC Spend Continues to Drop
Spend on the heating, ventilation, and air conditioning (HVAC) trade nationwide was 5% lower YOY in Q1 2025, while falling by 11% in New York.


The ServiceChannel Facilities Spend Index™ is based on $74 billion dollars in services delivered to 630,000 locations on the ServiceChannel platform since 2018.
“Data is the foundation for peak facilities performance. With actionable insights from dozens of metrics, we help to continually optimize our clients’ locations and assets. Being data-driven also accelerates progress. By benchmarking every brand and provider on our platform, we are driving continuous improvement and innovation across the industry.”
– Rigvi Chevala, Chief Product and Technology Officer, ServiceChannel

Across all trades on the ServiceChannel Platform, facilities spend set a new all-time high for the quarter, with budgets in Q1 2025 coming in 47% higher than Q1 2019.
Despite falling from peaks in Q2 and Q3 2024, service costs still rose by 4% YOY in Q1, driven by increases in material amounts and labor rates.
Since 2019, invoice costs have increased by over 6% annually, driven by both material costs (up 9% annually) and labor costs (time up 0% and rates up 4% annually).
Spend in Q1 2025 was 47% higher than 2019.
Total facilities spend saw a 7% year-over-year increase in Q1 2025.
Labor rates have increased 4% annually since 2019.
Service costs in Los Angeles rose 10% in Q1 YOY.
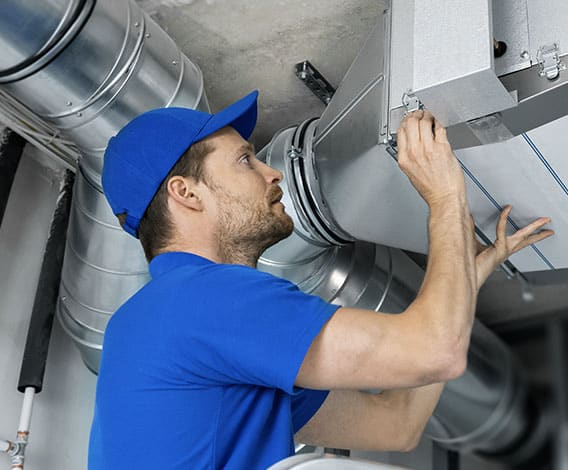
Spend on HVAC repairs, maintenance, and capital varies seasonally, with budgets 6% higher in Q1 than Q4 due to increased winter demand for heating.
HVAC invoice costs have risen by 8% annually since 2019, backed by labor rates up 4% and material costs up 10% per year.
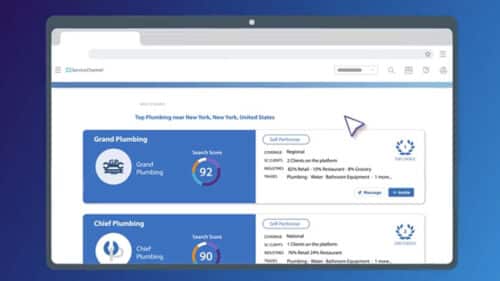
The top performing 25% of HVAC providers cost 62% less than those in the bottom 25%, and they arrive onsite 4 days sooner, based on our marketplace data.
Invoice costs for HVAC service increased by 15% YOY nationwide in Q1 2025.
Total HVAC spend fell by 5% YOY nationwide in Q1 2025.
In Los Angeles, HVAC spend increased by 5% YOY.
In Los Angeles, the typical HVAC service cost was 32% higher YOY.

The budget allocated to janitorial work declined by 4% in Q1 2025 vs. 2024.
Janitorial spend nationwide was 42% higher in Q1 2025 than 2019.
The typical janitorial invoice was 8% less than a year ago this quarter.
Janitorial spend nationwide declined 4% YOY in Q1 2025.
The cost for janitorial services declined by 4% YOY across the U.S. in Q1 2025.
Janitorial spend nationwide has increased by 6% annually over the last five years.
Janitorial service costs have declined by 1% annually over the last five years.

Budgets for plumbing work grew by 4% in Q1 2025 from 2024.
Invoice costs for plumbing nationwide grew by 7% YOY in Q1 2025.
Plumbing costs nationwide have risen by 7% annually since 2019, driven by increases in labor costs of 4% and material costs of 7% annually.
The top performing 25% of plumbing providers cost 38% less than those in the bottom 25%, and they fix issues on the first visit five times more often, based on our marketplace data.
Plumbing spend in the USA increased by 4% YOY in Q1 2025.
Plumbing spend in Q1 2025 was 52% higher than 2019.
Nationwide plumbing costs were 7% higher YOY in Q1 2025.
Q1 2025 plumbing service costs, across all states, have climbed by 48% since 2019.

Electrical service costs in Q1 2025 were up 7% nationwide in the last year.
This invoice cost growth translated into a budget increase of 21% YOY.
The top performing 25% of electrical providers cost 37% less than those in the bottom 25%, and they arrive onsite over 4 days sooner, based on our marketplace data.
Electrical spend nationwide grew by 21% YOY in Q1 2025.
Electrical service costs nationwide rose by 7% YOY in Q1 2025.
Nationwide electrical spend has grown by 11% annually over the last five years.
Electrical service costs in New York have grown by 8% per year since 2019.
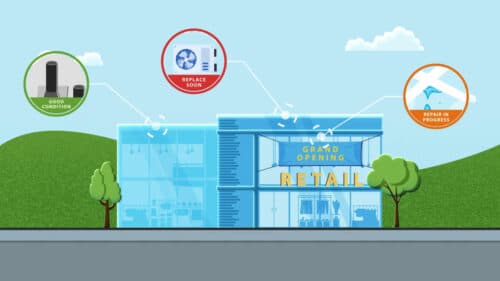
The Facilities Spend Index™ measures spend on facility operations across maintenance, repairs, and capital investments, based on $74 billion dollars in services delivered to 630,000 locations on the ServiceChannel platform since 2018.
Brands use ServiceChannel to track every service delivered to every location, so they get peace of mind through peak facilities performance and a consistent customer experience.
The related Service Cost Index™ measures the invoice cost for services delivered. The total facilities spend is a product of invoice cost and invoice volume.
To compare your facilities spend, providers, and assets to your industry peers, check out our benchmark reports for restaurants and grocery stores. For a customized assessment of how your program compares to industry benchmarks, please contact us.
Learn more about the methodology for the Facilities Spend Index →
See How You Compare
Let your Operations team focus on customer service and sales, so you can grow your business without limits.
Top brands use one integrated Facilities Management Platform to automate work orders, manage service providers, deliver amazing customer experiences — and higher ROI. See their stories.
Ensure you’re getting the best service and cost available by benchmarking performance and sourcing proven providers for every trade and location.