
Discover how European multi-site operators can reduce maintenance costs by 21% to 39% through better provider performance.
How European multi-site operators find 21 to 39% savings through better provider performance. The key insights below provide a concise view of the report. Download the full report for the complete analysis, methodology, examples and industry benchmarks.
Overview
Who Will Benefit From This Report?
This report is for facilities, operations and maintenance leaders managing provider networks across multiple sites and markets, with responsibility for repair and maintenance spend and a need to evidence provider performance beyond rate cards.
About the Data
The benchmarks are drawn from more than 5.7 million work orders across 68,000 locations and over $2 billion in tracked repair and maintenance spend. The data is US-generated, so local labour rates, currencies and compliance regimes differ. The central findings are relative performance gaps between top and bottom quartiles, not absolute European cost benchmarks.
A Note on Providers and Provider Networks
“Provider” refers to a trade contractor delivering repair and maintenance work. A provider network is the full group of contractors used by an operator. Providers should be compared with peers working in the same trade and market, using cost, speed and first-time completion.
1.0 Introduction
The Blind Spot in Your Provider Network
Every provider network has a bottom quarter, but many facilities teams cannot identify it. The providers creating the greatest cost are often not those with the highest hourly rates, but those generating repeat callouts, missing service levels and allowing unresolved work to erode the maintenance budget.
This blind spot is amplified in multi-site estates built through acquisition and spread across countries. Provider records are rarely held in one comparable format, even though top-quartile performance across retail, grocery and quick-service restaurants consistently delivers lower median invoice costs, faster service and higher first-time completion.
It Matters More Now Than It Used To
With closer scrutiny of facilities spend and tighter evidence requirements, teams need to show not only what providers charge, but how they perform. Every network includes strong and weak performers; the issue is whether the evidence exists to identify them before poor performance becomes avoidable cost.
2.0 What the Gap Costs
Cheaper Per Hour Does Not Mean Cheaper Per Fix
Compared within the same trade and benchmark population, top-quartile performance delivers median invoice costs 21 to 39% lower. Faster service and stronger first-time completion follow the same pattern, although the best-performing provider does not necessarily have the lowest hourly rate.
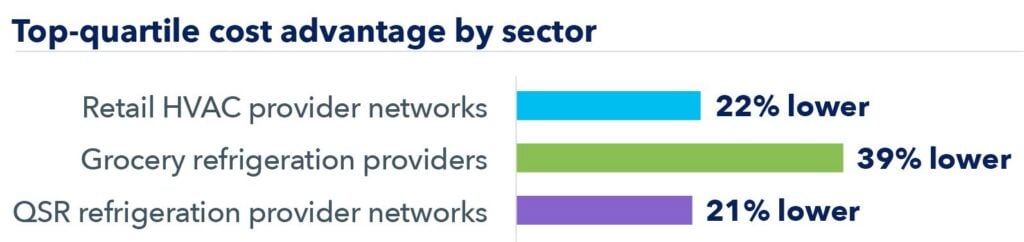
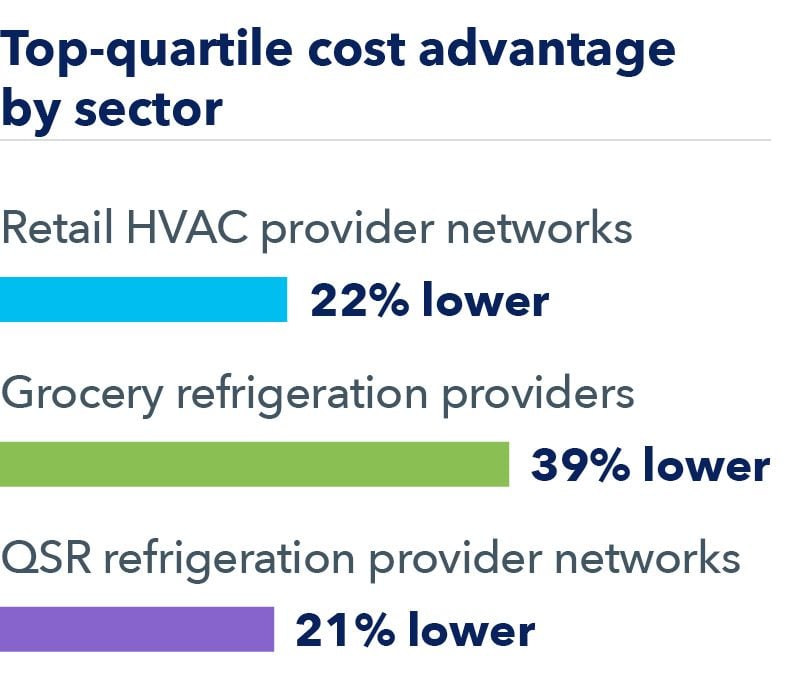
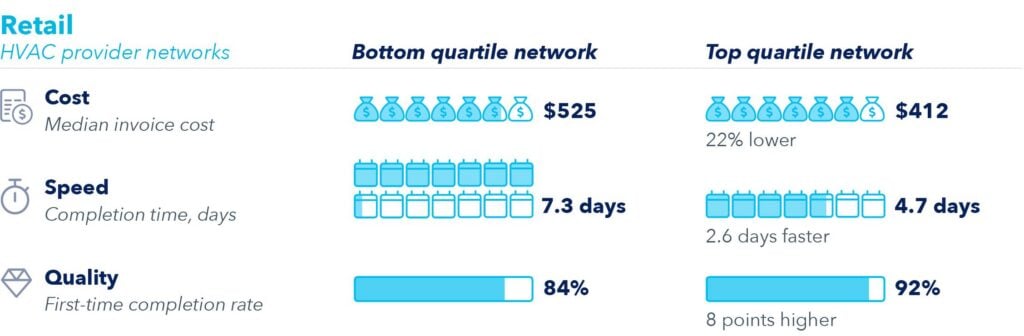
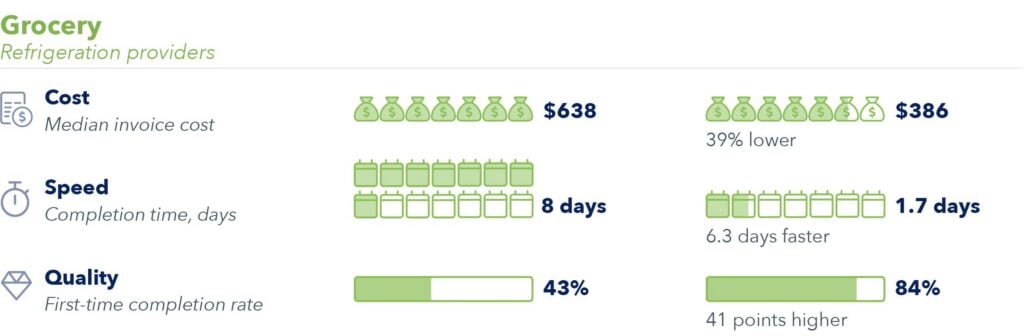
The sector comparison shows how the performance gap appears across cost, speed and quality. Speed is measured to completion in retail and quick-service restaurants, and to arrival on site in grocery, so day counts should be compared within sectors rather than across them.
Compared within the same trade and benchmark population, the gap appears in cost, speed and first-time completion
An illustrative model in the full report estimates that improving from bottom-ranked to top-ranked performers across five key trades could reduce repair spend by about 30%. These are scenario estimates based on US platform data, not guaranteed savings, and should be recalculated against the operator’s own spend, provider mix and local costs.
3.0 Hidden In Plain Sight
What You Can See at Tender, and What You Cannot
Rate cards are easy to compare at tender. Historic labour hours, return visits and days out of service are often not. Without that evidence, a lower rate can look attractive while the higher total cost appears later across separate invoices.
A provider that diagnoses correctly on the first visit bills once. A repeat visit adds another callout, travel time and further disruption. The savings are therefore not necessarily in the rate card; they are in the second visit that is not required.
4.0 How to Rank a Provider Network
Three Metrics
Rank providers against peers in the same trade and market using three measures: median invoice cost per work order, time from dispatch to arrival or completion, and first-time completion rate. Define the scoring method and minimum sample threshold before reviewing the results, then control for priority, planned versus reactive work and asset mix.
Cost
Median invoice cost per work order
Speed
Time from dispatch to on site, or to completion
Quality
First-time completion rate
Three Things the Ranking Reveals
- The provider handling the most work orders is not necessarily the best performer.
- No single metric decides the ranking: cost, speed and quality must be assessed together.
- Work-order volume affects how confidently the ranking can be interpreted.
| Provider | Work orders | Median invoice | Median days to resolve |
First-time completion |
Quartile |
|---|---|---|---|---|---|
| Provider C | 240 | €347 | 4.4 | 93% | Top |
| Provider F | 185 | €358 | 4.9 | 91% | Top |
| Provider A | 310 | €376 | 6.1 | 89% | Middle |
| Provider H | 150 | €389 | 7.0 | 85% | Middle |
| Provider G | 95 | €402 | 5.4 | 87% | Middle |
| Provider B | 205 | €421 | 6.6 | 88% | Middle |
| Provider D | 275 | €446 | 7.6 | 83% | Bottom |
| Provider E | 120 | €463 | 8.1 | 81% | Bottom |
A Real-World Scenario
In the report’s illustrative grocery scenario, 30 HVAC providers are ranked on cost, speed and first-time completion. Cross-referencing the ranking with spend and site importance reveals bottom-quartile providers covering high-footfall stores. It also identifies an asset serviced repeatedly by several providers, pointing to a repair-versus-replace review rather than a provider issue alone.
5.0 Acting on the Ranking
Turning Insight Into Action
A ranked network helps facilities teams decide which conversations to have first. It does not prescribe a single action, but gives teams evidence to focus on three questions:
- Are the weakest providers covering the most valuable sites?
- Which upcoming renewals should focus on performance rather than price?
- Which assets are failing repeatedly, regardless of who attends?
01
Are your weakest providers covering your most valuable sites?
Overlay the ranking onto the site list. Weak providers are rarely spread evenly across an estate, and a bottom-quartile provider covering the locations where downtime costs most in lost trade is a coverage problem rather than a contract problem. It can often be resolved by reallocating work to a top-quartile provider already active in the same region, without renegotiating anything.
02
Which renewals should be about performance rather than price?
Look at the contracts falling due in the next twelve months alongside the quartile each provider sits in. Renewal is the point at which you have leverage, and quartile placement tells you what to use it for. For a weak provider that need not mean termination. It can mean renewal conditional on reaching the network median, with the scorecard behind it.
03
Which assets are failing repeatedly, regardless of who attends?
Sort work orders by asset rather than by provider or date. An asset serviced repeatedly across several different providers may not be a provider problem at all. It is the kind of pattern that should trigger a repair-versus-replace review, and sorting by asset is the only cut that makes it visible. Most teams never look at their data that way, which is why a failing unit reads as a series of unremarkable jobs.
6.0 Where to Start
One Trade, One Market
You do not need clean estate-wide data to begin. Start with the highest-spend or most business-critical trade in one market. This keeps the comparison within one currency, labour market and compliance regime, making provider differences easier to distinguish from market differences.
The three metrics require invoice values, dispatch/attendance/closure dates and a record of whether the job required a return visit. Most estates hold these elements somewhere, even when the records are fragmented.
Expect the Records to Be Fragmented
Work orders often sit across email, spreadsheets and disconnected systems. Provider names vary and return visits may appear as new jobs. This is not a reason to wait. Begin with one trade and one market, then add a second trade in the same market and the same trade in a second market to test whether the pattern is provider-, trade- or market-specific.
01
One trade one market
02
Second trade same market
03
Same trade second market
See how your providers measure up
The benchmarks in this report show that top-performing providers can reduce repair costs by 21-39% while delivering faster service and higher first-time completion rates. Discover how your own provider network compares.
7.0 Closing and Next Step
A Gap You Can Measure
Across retail, grocery and quick-service restaurants, top-quartile performance is associated with median invoice costs 21 to 39% lower, faster service and higher first-time completion. The exact opportunity within an individual network depends on its trades, markets and providers, and can only be calculated from its own work orders and invoice records.
The key message is that the gap is measurable and large enough to investigate. Finding it starts with one trade in one market, not with an estate-wide system change.
Appendix: Industry Benchmarks
Retail
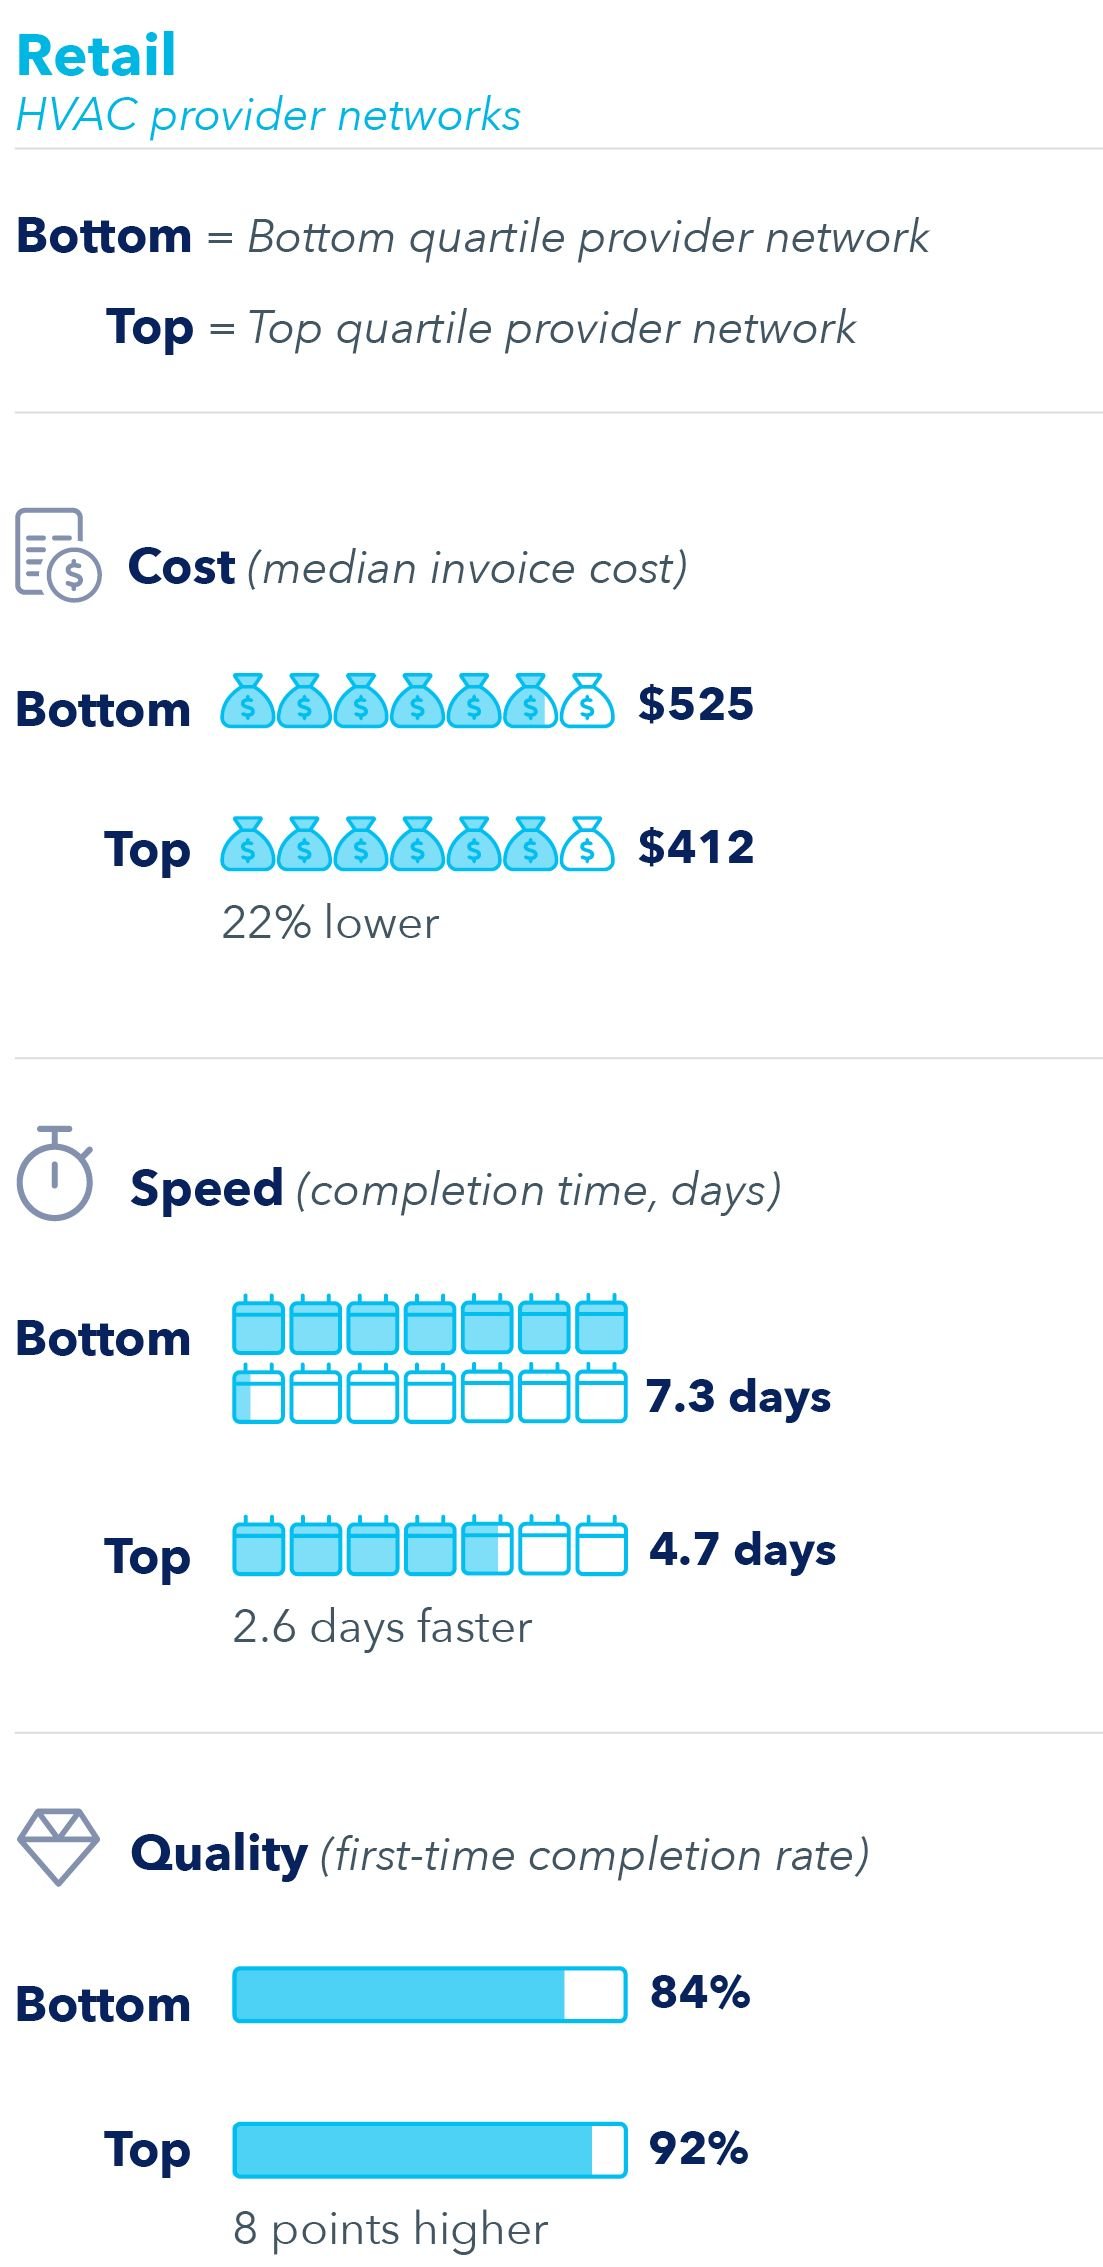
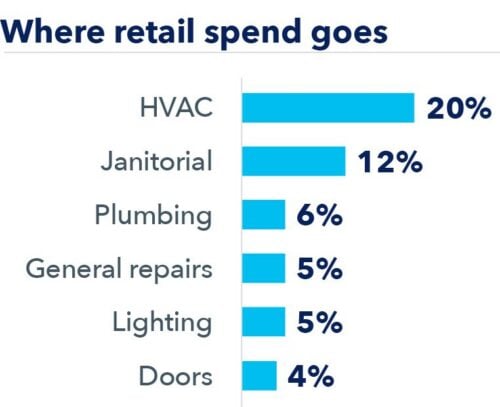
HVAC is the largest repair and maintenance trade in retail, representing 20% of spend in the benchmark. Top-quartile retail HVAC provider networks show 22% lower median invoice cost, 2.6-day faster completion and an eight-point higher first-time completion rate.
Grocery
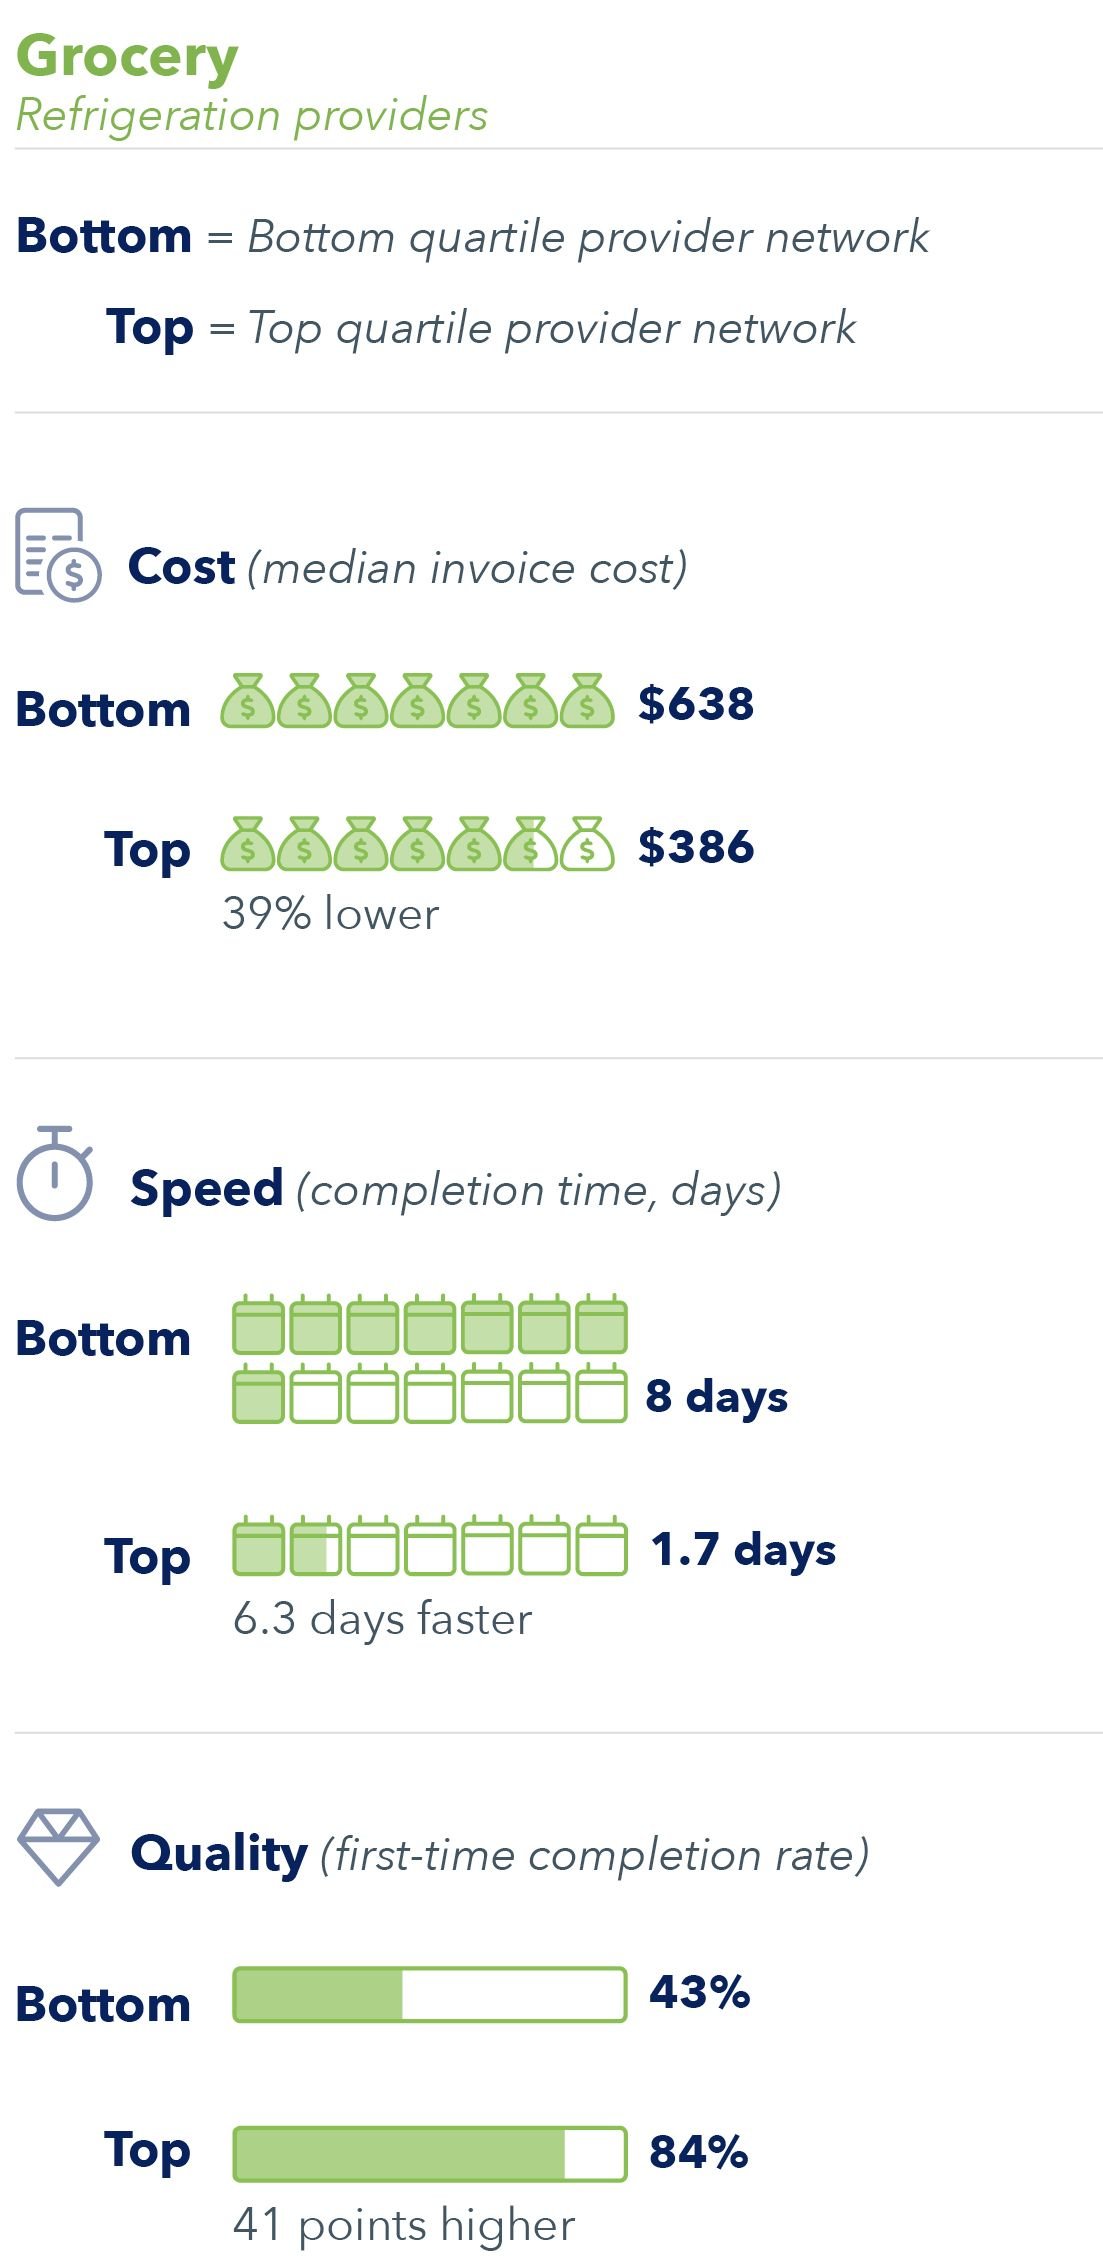
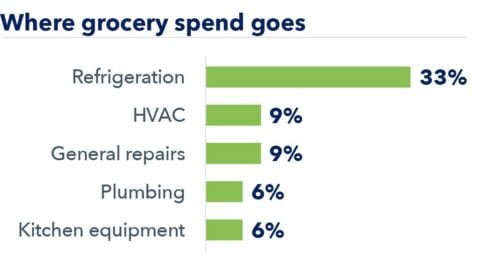
Refrigeration represents 33% of grocery repair and maintenance spend. Top-quartile refrigeration providers show 39% lower median invoice cost, 6.3-day faster arrival and a 41-point higher first-time completion rate.
Quick-Service Restaurants
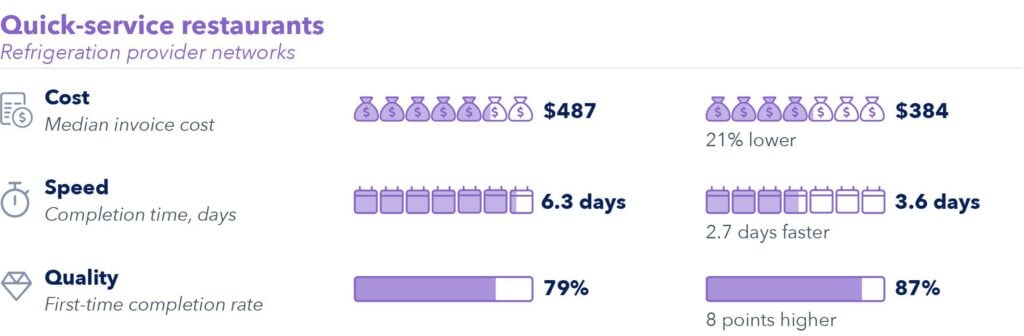
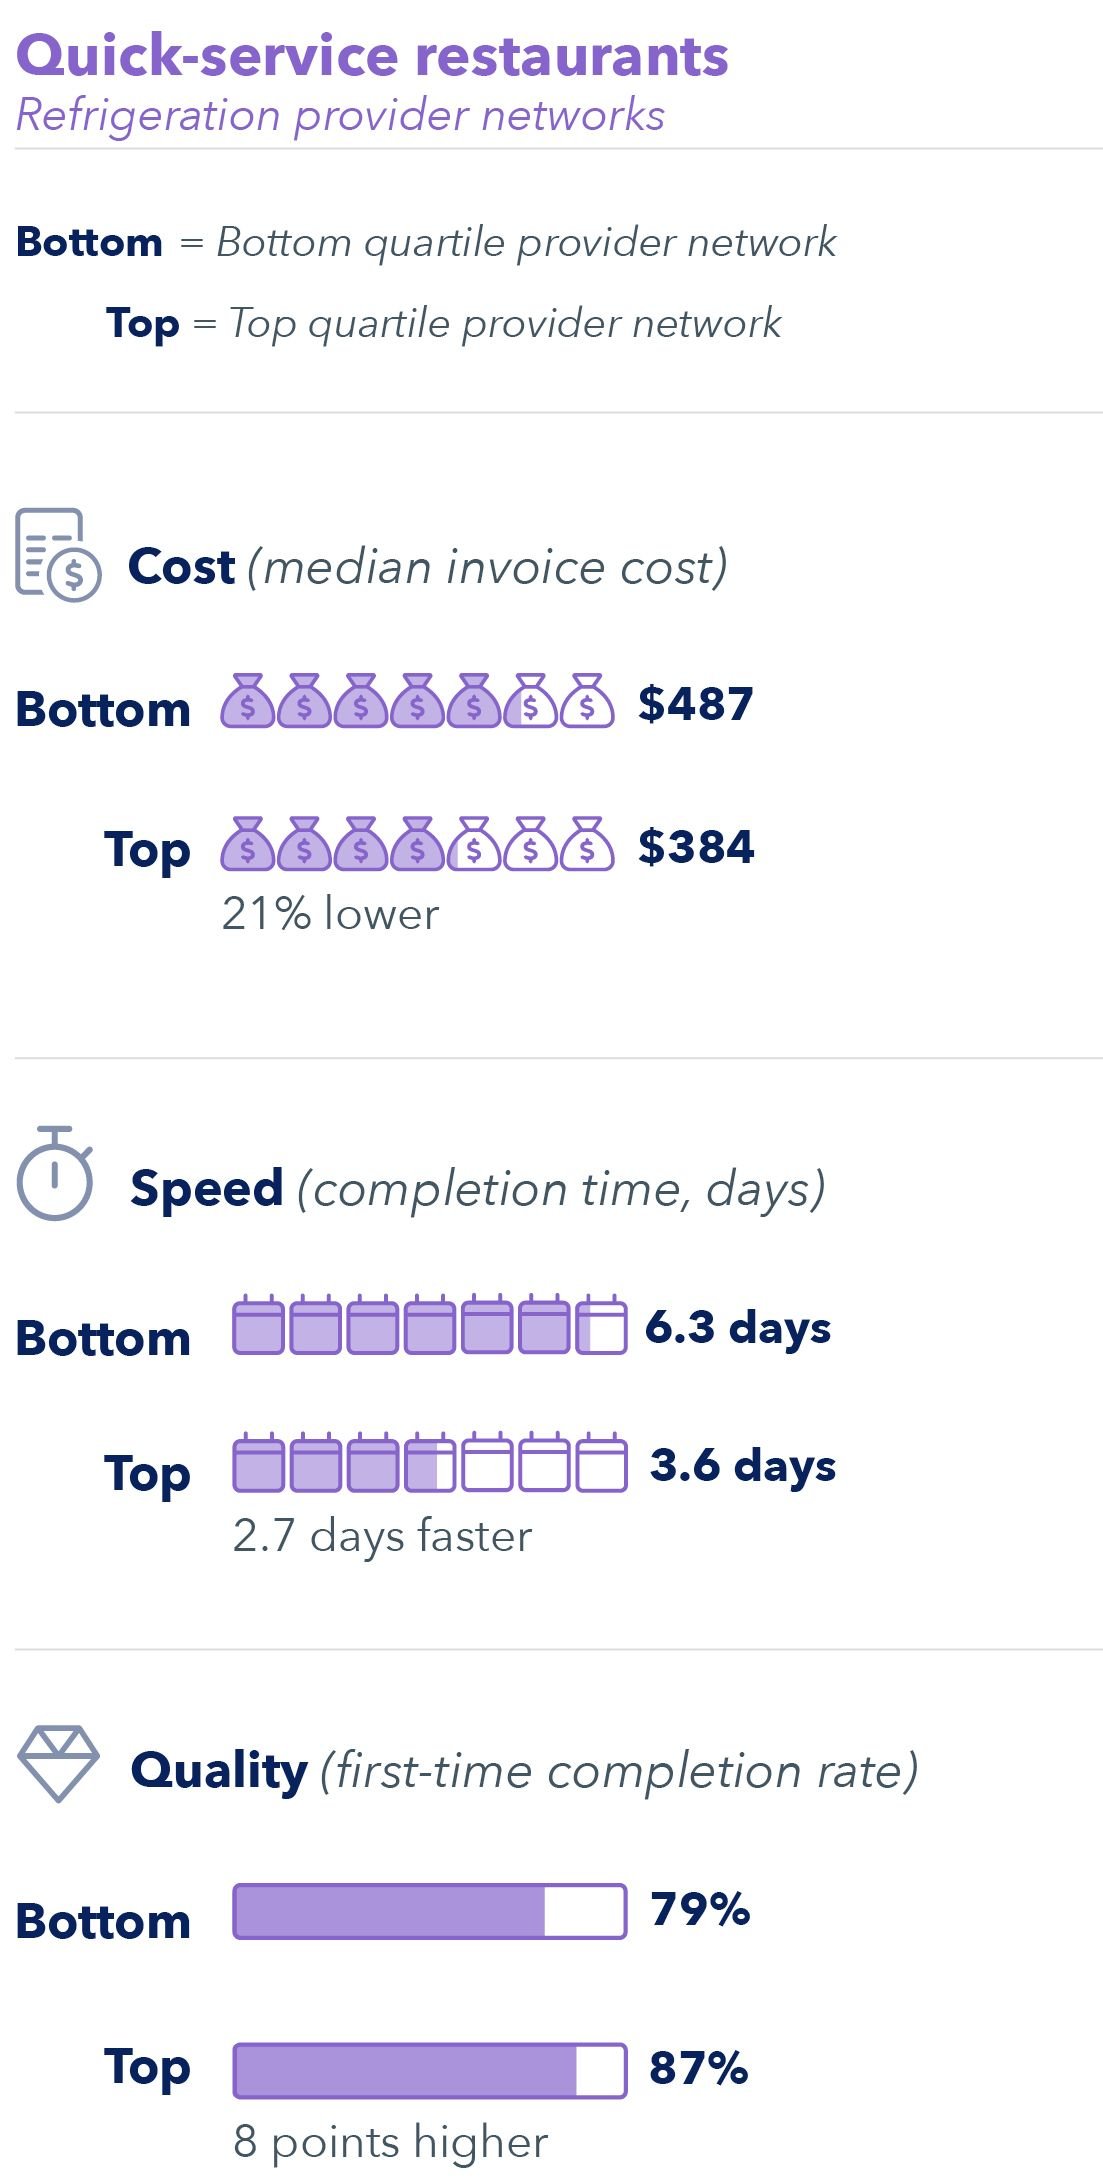
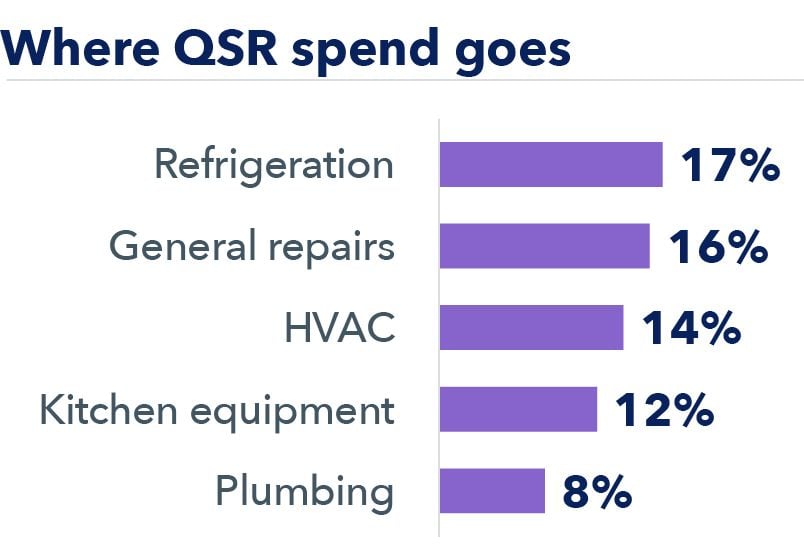
Refrigeration is the leading repair and maintenance trade for quick-service restaurants. Top-quartile provider networks show 21% lower median invoice cost, 2.7-day faster completion and an eight-point higher first-time completion rate.
Turn benchmark insights into action
Learn how data-driven facilities management can help you reduce costs, improve provider performance, and achieve better outcomes across your locations.