

ServiceChannel
Modified on
August 24, 2026
Table of Contents
See 2026 R&M and CapEx benchmarks for dental, veterinary, and urgent care facilities, plus HVAC costs and provider performance data.
Specific key metrics for retail healthcare brands investing in facilities management.
What’s Inside
In this report, you’ll find:
- Facilities spend breakdown on repair and maintenance (R&M) and capital expenditures (CapEx) spend for retail healthcare* locations in the U.S.
- Insights into the service provider marketplace, including gaps between top and bottom performers
- Analysis of R&M spend for the HVAC trade
- Costs to repair revenue generating equipment, with a close look into HVAC units
* Retail healthcare encompasses healthcare facilities that are part of multi-location brands or shared services organizations, including dental practices, veterinary clinics, and urgent care centers

Introduction
How do your retail healthcare facilities compare?
Spend by retail healthcare brands on repair and maintenance (R&M) is surging every year, putting facilities and real estate leaders under pressure to absorb rising costs while their portfolios keep growing and compliance mandates get tighter.
Average R&M spend per location annually rose to $10.5K in 2025, up 4.7% year over year (YoY), driven primarily by an increase in work order volume of 3.8%. This YoY growth in total facilities R&M spend further emphasizes the broader trend of continued cost pressures at the site level.
What are you spending each year on repairs and maintenance?
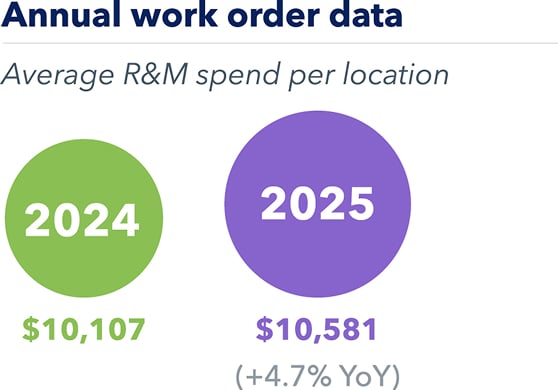
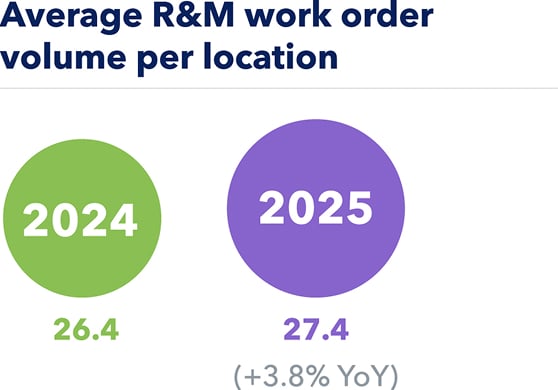
Footnote: Retail healthcare benchmarks are based on 2025 and 2024 facilities data from over 196,400 work orders. Marketplaces provider information sourced from ~791 service providers and over $90.6M in R&M spend tracked via the ServiceChannel platform.
Note: Outliers on some categories were excluded to preserve data integrity.
Repair and Maintenance Insights
The cost of R&M for retail healthcare facilities
As inflation and other economic pressures continue to drive facilities maintenance costs higher, it is more important than ever for facilities leaders to leverage benchmarking data to effectively optimize their provider networks, improve asset performance, and make more informed maintenance and investment decisions.
Some facilities maintenance software now incorporates AI functionality, which can be one lever teams pull to optimize processes and reduce spend. A 2026 Worldmetrics survey reports that AI-powered maintenance tools can help reduce equipment downtime by up to 25‑30%! Successful facilities managers use benchmarking statistics to analyze how maintenance programs are performing compared to industry peers, empowering them to build smarter, more defensible budgets.
“[With AI summaries] I can get up to speed on a work order in a matter of seconds, rather than digging through work order history and notes.”
Senior Manager, Retail Facilities
See how ServiceChannel AI helps reduce friction in facilities work management.
See AI for facilities ›
Retail Healthcare Spend Breakdowns
Where retail healthcare brands spend the most
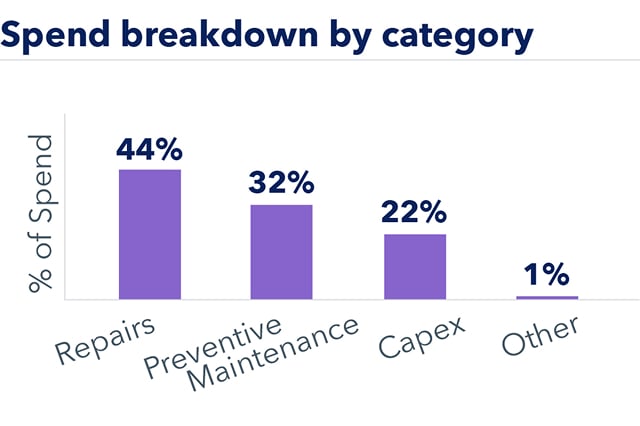
Reactive repairs take up almost half of FM budgets, with 44% of the total. As critical assets age, the cost of reactive repairs and operational disruptions from downtime grow. Proactive maintenance helps identify issues early, extend asset life, and make maintenance spending more predictable. Every dollar invested in preventive maintenance (PM) can reduce repair costs and minimize unplanned downtime, potentially freeing up budget for capital investments and facility upgrades.
Do you have a proactive maintenance plan in place?
Factors that influence spend and work order volume:
› Brand standards and facility experience expectations
› Number and complexity of facility assets, including asset age and condition
› Vendor and service provider network selection
› Facility size, infrastructure age, and lease terms
› Service provider availability and performance across regions
Invoice cost itemization
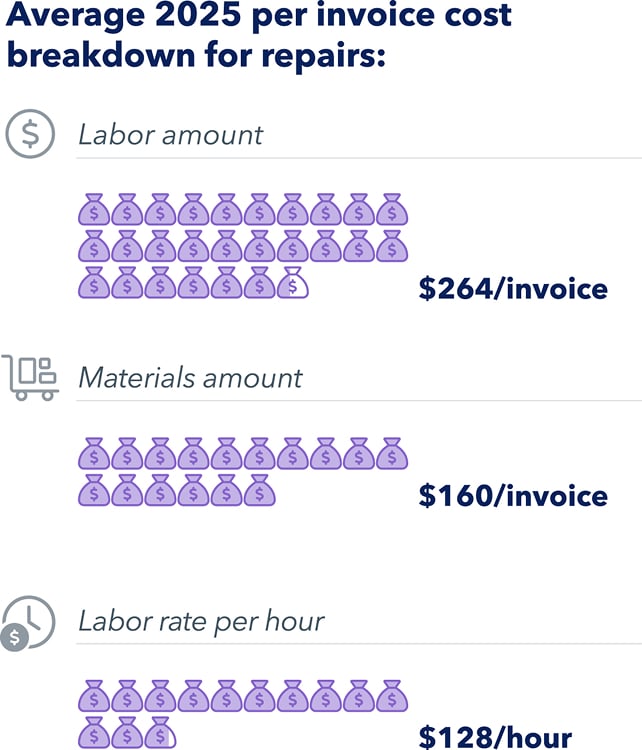
Invoice costs are driven primarily by labor, accounting for 50% of the total, with an average hourly labor rate of $128. Materials are the secondary factor, making up 30%, with an average of $160 per invoice.
Brands use ServiceChannel to track cost trends like these and validate that they are paying the market rate for labor, materials, and hours on every invoice. This is essential for controlling budgets, optimizing vendor negotiations, and improving forecast accuracy year over year.

Trade spend
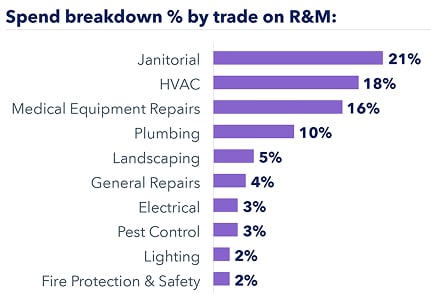
Trade spend shows janitorial services accounting for the largest share at 21% of spend, followed closely by HVAC at 18% and medical equipment repairs at 16%. Tracking spend by trade helps facilities managers pinpoint where their R&M budget is going. With visibility into trade spend through a facilities management platform that captures this data, managers can quickly identify where vendor costs are concentrated, allowing them to prioritize sourcing efforts and negotiate competitive rates with specialized providers. It also supports a shift from reactive fixes to more strategic, targeted capital planning.
Which trades are driving the largest share of your R&M spend?

Trade Insights
The financial impact of HVAC
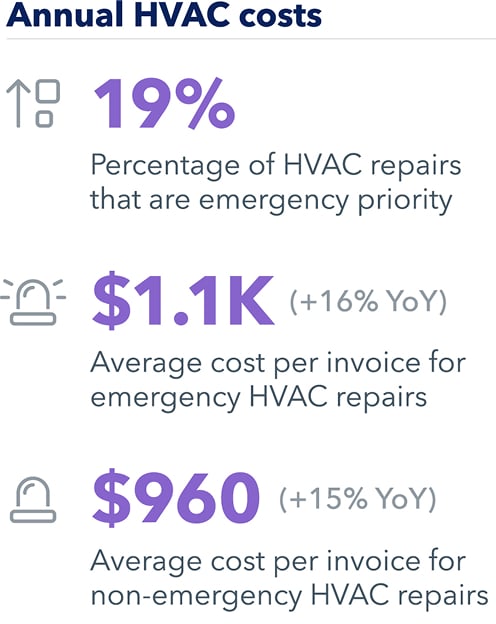
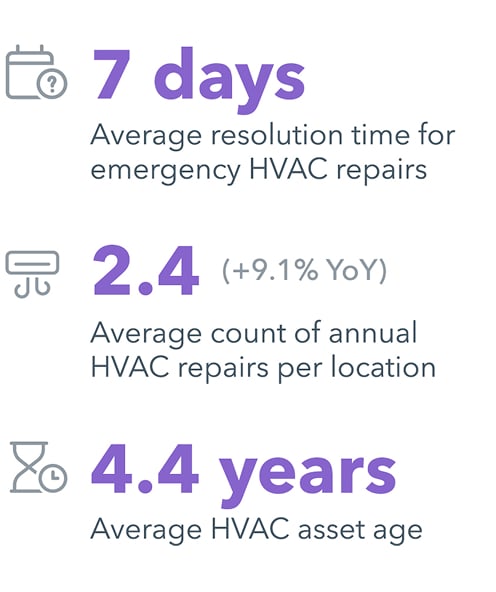
Emergency HVAC repairs (requesting the provider to arrive in less than 4 hours) cost 14% more than non-emergency repairs while still taking nearly 7 days to resolve, reinforcing the value of preventive maintenance as the cost-effective, non-disruptive way to manage critical systems and reduce downtime. With the average invoice cost of emergency HVAC repairs climbing 16% annually, facilities leaders that lock in long-term maintenance contracts can prevent costly emergency repairs while keeping costs under control.
How are you keeping track of your critical assets?
Discover how ServiceChannel helps with asset management.
Request a demo ›
Provider Insights
Sourcing the best HVAC service providers
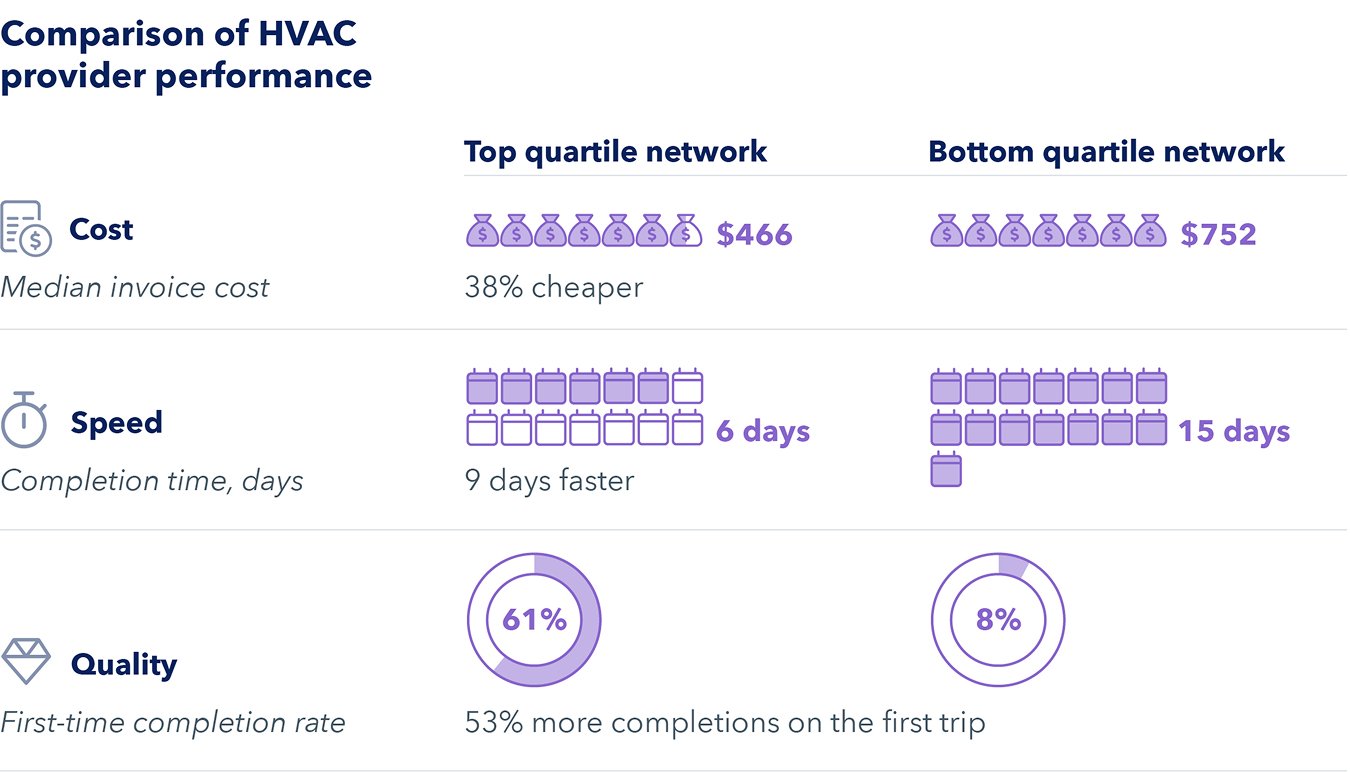
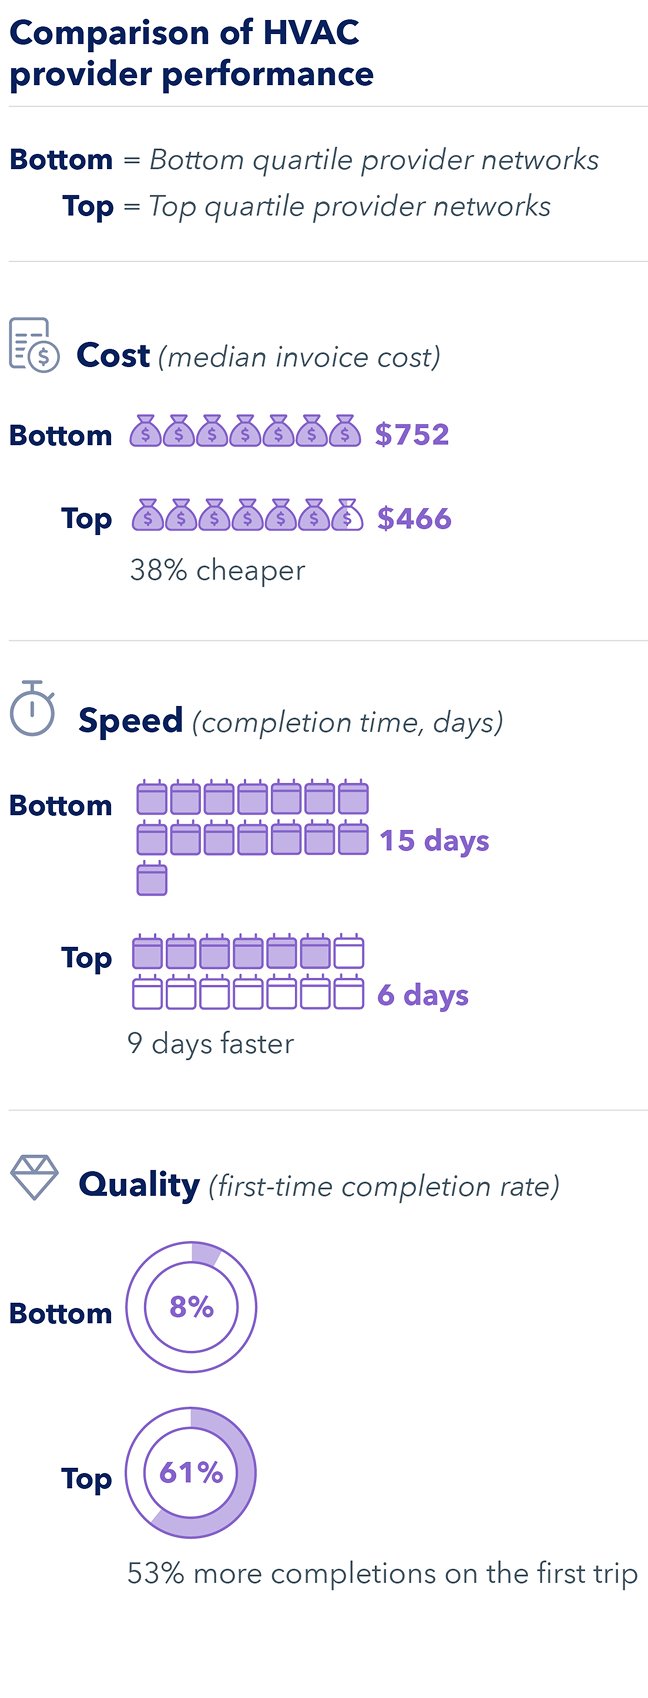
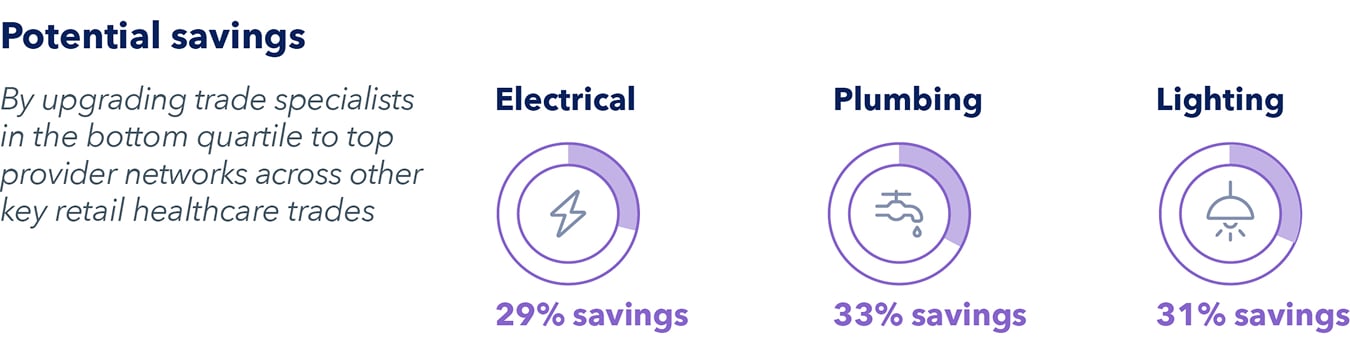
Optimizing your provider network is key to lowering R&M costs, and brands have noticed the difference. Efficient, high quality repairs minimize asset downtime, driving down expenses while increasing customer loyalty. For instance, businesses with provider networks in the top quartile spent up to 38% less on HVAC repairs than those with networks in the bottom quartile of performers.
Wrap Up
Take charge of your success
Navigating facilities management for a multitude of locations without full visibility is a challenge many retail healthcare leaders face. What kind of visibility do you have across your clinics? The ServiceChannel platform closes this gap by delivering comprehensive facilities intelligence at every location.
If you re navigating facilities spend or procurement without a full view of performance, you re not alone. We can help! Whether you re guiding an in house facilities management team, self managing a network of facilities, or outsourcing help while still craving transparency, the ServiceChannel platform gives you access to the most comprehensive, retail specific facilities intelligence in the industry.
Successful facilities leaders are using this data every day to improve the patient experience and justify proactive investments, all while achieving cost savings in the areas that matter.
“We went from a system of being very human‑dependent to an automated solution that delivers faster service to our offices and better communications to our vendors.”
Director of Facilities and Dental Equipment, Retail Healthcare
Stop guessing and start improving. Let’s chat about your facilities management strategy. See a live demo from our experts.
Learn more ›
Stop guessing and start improving. Let’s chat about your facilities management strategy. See a live demo from our experts.
Learn more ›

Understanding the Numbers
How to use this data
Consider these questions and resources for your facilities management strategy.
Asset management
- Which assets cost the most for R&M?
- How am I keeping track of vital retail healthcare assets and work done on them?
- What is the average age of my equipment? Do I have a way of tracking that?
- What preventive maintenance measures do I have in place?
Spend optimization
- How is our invoice volume and cost changing? Do I have access to this information?
- Do we spend more or less than average? Does our data explain why?
- What percentage of our facilities budget goes towards repairs?
- Which trades and categories present savings opportunities?
Provider performance
- Are we working with top providers? How do we know?
- How much could we save by upgrading our provider network?
- What quality improvements can be achieved when upgrading our provider network?
See how other retail healthcare brands saw success with ServiceChannel
Ready to see it for yourself?
Learn more ›
Ready to see it for yourself?
Learn more ›